Sunday, May 16, 2010
Choosing a participatory mapping method versus another
The choice of method should emanate predominantly from within the community . Participatory maps often represent a socially or culturally distinct understanding of land and seascapes and include information that is excluded from mainstream maps. These usually represent the views of the dominant sectors of society. Participatory maps can pose alternatives to the languages and images of the existing power structures and become a medium of empowerment by allowing local communities to represent themselves spatially.
For this reason, participatory maps should be made through an inclusive process at community level. The higher the level of participation by all members of the community, the more beneficial the outcome because the final maps, and related outputs like multimedia, will reflect the collective knowledge, concerns and aspirations.
In September 2010, CTA and IFAD will launch a Training Kit dedicated to “Participatory Spatial Information Management and Communication” and having the specific objective of supporting the spread of good practice in generating, managing, analysing and communicating spatial information. More information on the training kit will be made available on the Internet and on this blog.
Wednesday, April 21, 2010
Rethinking the Power of Maps
 A contemporary follow-up to the bestselling Power of Maps, this book takes a fresh look at what maps do, whose interests they serve, and how they can be used in surprising, creative, and radical ways.
In Rethinking the Power of Maps, Denis Wood describes how cartography facilitated the rise of the modern state and how maps continue to embody and project the interests of their creators. He demystifies the hidden assumptions of map making and explores the promises and limitations of diverse counter-mapping practices today.
Thought-provoking illustrations include U.S. Geological Survey maps; electoral and transportation maps; and numerous examples of critical cartography, participatory GIS, and map art.
Wednesday, March 24, 2010
Power of Maps: (Counter) Mapping for Conservation
The authors argue that in doing so enriches consideration of the power geometries of conservation cartographies by inviting fuller consideration of diverse species and landscapes, as well as enabling discussion of other representational and productive effects of conservation mappings. Once determined, how might conservation maps serve to naturalize certain spaces or boundaries as fixed, or contribute to certain socio-psychological understandings of conservation possibilities or outcomes?
In the closing sections, the authors invoke the idea of ‘counter-mapping’ to explore strategies that might redress these concerns. Possibilities range from efforts to adapt the form of protected areas to more critical approaches that question the appropriateness of territorial focus and mapping practices for conservation goals.
In conclusion, Harris and Hazen argue that theorizing power in human, other-than-human, and inter-species contexts is essential to understanding the power geometries of conservation mapping.
Citation: Leila M. Harris and Helen D. Hazen, 2006. Power of Maps: (Counter) Mapping for Conservation. ACME: An International E-Journal for Critical Geographies, 4 (1), 99-130
Sunday, February 21, 2010
Mapping the Sea - Improving Livelihoods
In 2005, when the Tsunami hit Banda Aceh in Indonesia, it killed many of the elderly fishermen. Much of the traditional knowledge about the waters surrounding Banda Aceh was lost with them. Traditionally this precious knowledge was transferred from generation to generation. In the post-Tsunami vacuum, this community-led initiative was able to retrieve and document some of that endangered knowledge.
This video documents the efforts done in one community, where traditional authorities coordinated the mapping of the coastal waters including the sea floor. So far 460 km of coastline have been mapped including previously unmapped features like four seamounts, four geologic faults and eighteen coral areas. In addition to the physical data, the community documented key biodiversity areas including shark nurseries, nesting beaches, spawning grounds. Data will be used to support the development of coastal resources and fisheries management plans.
According to Sumatra Konservasi Alam this project was completed at minimal cost (less than 10% of the cost of a conventional survey) and in less than one year. More information on the initiative is found at http://www.konservasi.org
Sunday, February 07, 2010
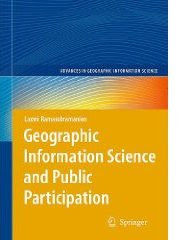
Geographic Information Science and Public Participation
 Computer-mediated participation is at the crossroads. In the early heady days of the digital revolution, access to "high" technologies such as GIS promised the empowerment of marginalized communities by providing data and information that was previously hidden away from public view. To a great extent, this goal has been achieved at least in the U.S. and Western Europe – data about a range of government initiatives and raw data about different aspects of spatial planning such as land use, community facilities, property ownership are available a mouse-click away. Now, that the public, have access to information, are we able to make better plans for the future of our cities and regions? Are we more inclusive in our planning efforts? Are we able to foster collaborative governance structures mediated by digital technologies?
In Geographic Information Science and Public Participation (Advances in Geographic Information Science)
The foreword for the book is written by Prof. Bill Huxhold.
Monday, February 01, 2010
Community Mapping in Tsunami Affected Areas in Aceh, Indonesia
The documentary has been jointly produced by the Indonesia Community Mapping Network or Jaringan Kerja Pemetaan Partisipatif (JKPP), and the Center for people Economic Development or Yayasan Rumpun Bambu Indonesia (YRBI).
More videos on participatory mapping are found here.
Friday, January 22, 2010
Peter Poole traces the evolution of participatory map-making
In this interview, Dr. Peter Poole traces the evolution of a participatory map-making which commenced with the introduction of GPS to the Inuits in 1989 and evolved throughout the 1990s via a series of projects in the Amazon, the Arctic and Asia.
Tenure maps depict indigenous names, resources and special places on scaled maps, intended as evidence in negotiating processes. Peter describes the search for cheap, simple, appropriate geomatic technology. Community-based teams would gather raw field data and indigenous associations or support NGOs, set up mapping units to serve the field teams.
Three lessons are described: (i) communities can make their own scaled maps, (ii) emerging mapping centres should make their services accessible to all communities, (iii) this methodology not only produces a tenure map, but also equips and inspires community mappers to diversify their skills in environmental information management.
Tuesday, January 19, 2010
What 3-D mapmakers should know about expanded EVA / PE closed-cell foam or sponge
 Expanded EVA / PE closed-cell foam or sponge is usually made out of a blend of Ethylene Vinyl Acetate copolymer (also known as EVA) and polyethylene. The product is a lightweight foam material which has a smooth surface and does not absorb water. Generally EVA sheeting is priced competitively, compared with other blown materials and is available in different densities, thicknesses and colours.
It is one of the materials most popularly known as expanded rubber or foam rubber sheeting.
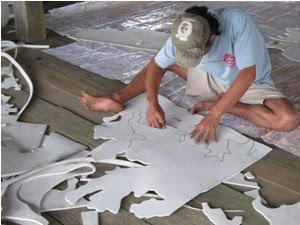
EVA foam is used to produce - among others - mouse pads, flip flops and sports mats. Sheets of the material can be used for manufacturing Participatory 3D Models.
Models made out of this material are well suited for humid tropical environments where carton board may deteriorate rapidly.
Manufacturing a 3D model using 'expanded EVA / PE closed-cell foam' compared to carton board implies a slightly higher cost and non biodegradable debris, but ensures a more durable output and a consistent vertical scale/exaggeration of the 3D model. Insertion of map and push pins is easy.
More information on the topic is found here.
Friday, January 08, 2010
Interview with Steve deRoy about the role of networking and communication in PGIS practice
In this interview, Mr. Steven DeRoy illustrates the power of networking and the importance of integrating this practice into the daily realm of PGIS. These professional exchanges create an opportunity to dialogue with likeminding professionals, allowing practitioners to share ideas and approaches to solve common challenges. Maps also play a vital role in communicating ideas amongst different parties and for advocating change in current affairs
Friday, November 27, 2009
Eco-cultural mapping to protect natural resources and sacred sites, South Africa
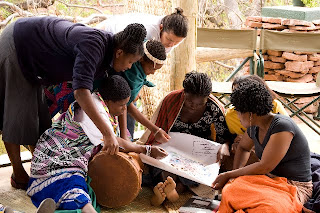
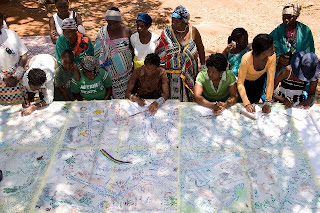
 With support from CTA, women, men and youth from Tshidzivhe community, in Limpopo province, northern South Africa, spent six days exploring ways to ‘map’ their traditional knowledge and practices for managing their natural resources. As the different maps were finished, the local people celebrated their new capacity to express traditional environmental knowledge in an appropriate way for gaining recognition, reviving traditional practices and securing their rights.
This was a unique mapping experience that involved local people as well as indigenous from other parts of the world. More than 70 vhaVenda people took part, guided by trainers in eco-cultural mapping from Colombia and accompanied by indigenous leaders from the Colombian Amazon and the Russian Republic of Altai. The process required the full participation of community members, especially the elders and the makhadzis, women custodians of sacred sites, but with minimal materials or technology.
 Four maps and two ecological calendars were produced, covering what the local population refers to as “Venda territory” and with special attention to the main sacred sites. The maps show the changes and alterations to the land - the past, present and future visions - and the importance of recovering traditional practices and rituals.
Trainees from Kenya and Ethiopia, members of the African Biodiversity Network, took part and hope to carry out similar workshops in their respective countries in 2010.
Photos by Will Baxter, text by Fiona Wilton / The Gaia Foundation
Thursday, October 22, 2009
The future of environmental law mapping
 Laurent Granier from ecocy recently wrote an essay on the future of environmental law mapping where he argues GIS and mapping tools are transforming our vision of legal data, “from vertical books to horizontal maps”. Drawing on examples of online mapping tools and representations, including participatory GIS, he shows a tendency for law and policy makers to aggregate administrative and legal layers in maps, towards more and more legally binding tools.
Saturday, October 17, 2009
Educational Video ob CyberTracker - Tracking in the Cyber Age
The CTA recently released an educational video on CyberTracker technology. The video has been produced in the context of the development of a training kit aimed at supporting the spread of good practice in generating, managing, analysing and communicating spatial information. This 8-min video on CyberTracker covers a number of uses to which geospatial information technology (GIT) can be put to work in the contexts of development and conservation.
CyberTracker is an open-source software developed in South Africa by the Cybertracker Conservation with financial support initially provided of by the European Commission. It can be installed on a GPS-enabled handheld device such as a Personal Digital Assistant (PDA) or a Smartphone to collect geo-referenced data with detailed digital notation. It is a highly efficient way to gather large quantities of geo-coded field observations at a speed and level of detail not possible before. CyberTracker allows users to customise the interface to meet data collection needs. Screen designs can combine text and icons to optimise efficiency and customisation. The CyberTracker icon interface was originally designed for trackers who could not read or write. Nowadays all users including scientists and conservationists benefit from the icon-based interface because it enables significantly faster data entry.

