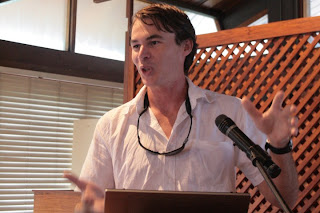
24 May, 2012, HONIARA - The morning of day 4 opened with a presentation on the potentials of Web 2.0 applications and social media for remote collaboration, social development and advocacy by Giacomo Rambaldi. An highly socio-technologically defining video on Web 2.0 realised by professor Michael Wesch, Kansas University, USA, introduced the main characteristics of Web 2.0 applications, drawing attention to the shift from the old way to understand and use the Web (passive use of somebody else’s content) to the active participation and interaction among users reached today through Web 2.0. Applications such as Wikis, social networks, social bookmarking, on-line mapping, among others, enable the exercise of the “human dimension of technology”, allowing people’s active participation in the production of online content, the sharing of information, the creation of communities of practices and the development and nurturing of networks for social and professional purposes. In the frame of development initiatives, Web 2.0 applications offer powerful and easily accessible platforms that can be used by development actors in diverse contexts and for a range of purposes including disaster risk management, and other climate change related issues.
The presentations which followed addressed the integration of traditional and scientific knowledge systems, providing examples of participatory approaches and initiatives carried out in the Solomon Islands and in the Caribbean. In the frame of the development of climate resilient integrated resource management system in Western Solomon, Dr. Simon Albert from Queensland University presented positive examples of how best to incorporate Traditional Ecological Knowledge (TEK) into scientific programmes on marine conservation, while, at the same time, promoting the integration of science into community planning. Among these experiences, the training of community members in monitoring sea level, conducted in 40 provinces, proved to be effective in offering a rapid method for flood risk assessment. Monitoring datasheets were compiled in vernacular language. The initiative actively involved the youth in capturing data, contributing to raising awareness on environmental issues.
Professor Bheshem Ramlal from the University of West Indies (UWI) in Trinidad and Tobago addressed the issue of merging TEK and scientific knowledge in Caribbean, presenting the case of a turtle conservation project. This included training on turtle watching, compilation and dissemination of information on environmental practical strategies and the development of community development plans. The project was successful in integrating local knowledge with scientific tools, increasing the level of awareness and empowering the community.
Both speakers agreed on the fact that TEK provides unique historical, and frequently offers ecosystem linkages that science can not. However, for being based on repetitive observation, trial and error, TEK might have a limited ability to detect and deal with rapid changes, such as those related to the impacts of climate change. Therefore, the need to bridge the gap between local knowledge and science becomes urgent to find sustainable solutions for ecosystem management and adaptation to climate change. If, on the one hand, the incorporation of TEK into scientific tools (such as GIS) can provide an useful platform to document and give value to TEK in contemporary contexts, on the other hand the development of easy-to-use scientific tools for communities can enhance people’s engagement in the conservation activities, increasing their self-resilience, specially in those countries where government capacity is limited.
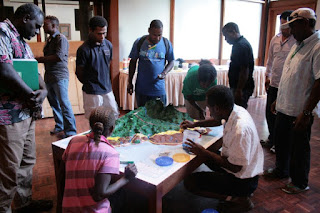
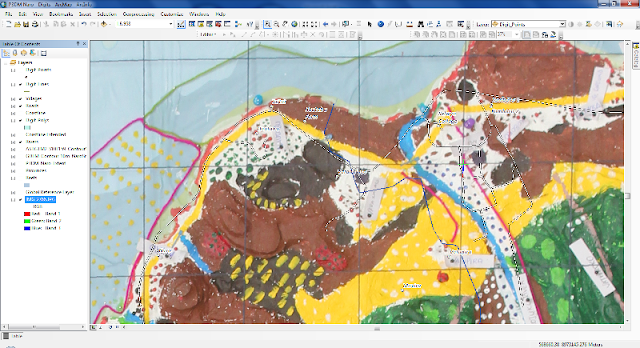
In the meantime villagers had completed the 3D model which accounted for a wealth of information manifest by a total of 39 data layers including 18 area, 6 line and 15 point features.
Joseph Salima from the village of Naro, presented the 3D model to the workshop participants on the behalf of the village representatives: “The model is now done. You can see the blue lines These are rivers; dark blue lines indicate streams”, he explained while finger-pointing to the features. “Some cross the main road because during flooding the water runs over the road. The yellow line indicates the main road. Within the model there are two mountains covered by dense forest where our ancestors used to practice sacrifices. These are the places were our ancestors lived before the Christianity came. They lived there (upland) because of hunting. The brown lines are the tracks people used to follow during hunting. (…) White areas are flood areas.
The brown colour signify coconut plantations, that are along the coast. The area outlined by the red yarn is our Marine Protected Area (MPA)”. When questioned on the reason why the locally managed protected area is located in front of the village he replied: “Our place is here so we have the full sight on the protected area. We could not establish it elsewhere because people from other villages could have had something to say. We want to protect this area because the population in the village is growing and we are experiencing shortage of resources” he specified. Joseph continued by identifying other landmarks and areas, including home gardens, coconut plantations, households, the school, springs¸, swamps and mangrove areas.“ The area painted dark green with light green points indicates the area were logging took place. The logging concession has come to an end and the forest is recovering. We hunt wild pigs there” he added.
P3D Model gave villagers the opportunity to visualise and further their understand their land and resources “we discovered there are slopes we never saw before that could not be used for agriculture; now with this model we can see them”.
Looking back two days when Joseph and his village mates were standing around the blank model feeling challenged by the task one could clearly see a transformation. He looked confident when presenting all feature on the model. What happened during the process to make this change possible? Joseph was asked. “Filling up the information on the model”, he replied “we could locate yourselves vis-a-vis the map, and we could recognizing the whole model. The 3D model is much more clearer than a topographic map because here we can see the slopes and where the rivers are. It is much more close to reality”, Joseph stressed.
On day 6 the organisers have planned to transport the model to Naro and officially hand it over to the local community. The community itself will decide to what uses it will put it in addition to participatory spatial planning. Considering the fact that the area is prone to natural disasters such as flooding, it is likely that it will be used to also to strategise on climate change adaptation.
“It is my responsibility to get the people together and share with them about this model and its uses. With this model you can easily locate where primary and secondary forest are, where hunting tracks are. With this model we can make decision. This is a live model” Cornelius Nulu concluded.
Villagers stressed the need to further involve elders in the identification of other landmarks and features that they might do not know. “This model is maybe 90% correct; it is quite clear but we needed somebody as my father, or somebody from the village that used to hunt wild pigs everyday for a long time” Joseph highlighted. “If elders were involved in populating the model it is likely that up to 50 layers could have been identified so far” commented Dave de Vera. Village representatives also expressed their intention to extend the model involving other parts of the marine and forest conservation areas.
Back to the plenary session, Nate Peterson GIS geek working for TNC, explained how to capture data via digital photography and he provided a practical demonstration of data extraction and geo-referencing, using a high resolution image of the completed 3D Model. He also cross-checked peoples’ data against official datasets and could demonstrate how accurate and precisely geo-located some features entered by community members were.
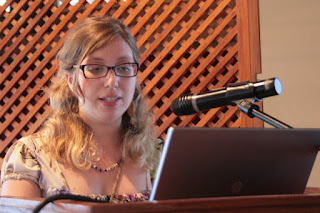
His demonstration was followed by a presentation delivered by Ms. Antonella Piccolella from CTA. She provided clear insights on internal and external factors that may affect participatory mapping processes, in both a positive or negative manners. Ms Piccolella called the attention on the existence of an enabling climate change policy environment for fostering grassroots engagement in climate related decision making processes. The National Adaptation Programme of Action (NAPAs) framework is based on the idea that affected communities should identify the causes of their vulnerability and propose possible solutions. However, she emphasised that to date only few NAPAs explicitly refer to traditional knowledge and grassroots participation and suggested that NAPAs provide definitely an opportunity to look at.
Afterwards, Jimmy Kereseka addressed the use of Information and Communication Technologies (ICTs) for community based planning and information sharing. He provided an overview of participatory tools that can be used for land use and climate change adaptation planning at community, provincial an national level, including participatory mapping and participatory video.
The experience of the Chivoko community in using P3DM and participatory video (PV) was shared by Mr Kiplin, chief of the village. “It is a privilege of be here today on behalf of my community”, he said. “Comparing with other communities, my community was the first in to use P3DM. Two of the main issues we are facing here in Solomon Islands are logging and mining. Mining is recent while logging has been practiced since a long time (…). From a village perspective, making a PV has been a useful experience since it gave us the opportunity to portray a real picture of the logging activities undertaken in our area. In making a video everybody can see the reality of the community” he pointed out.
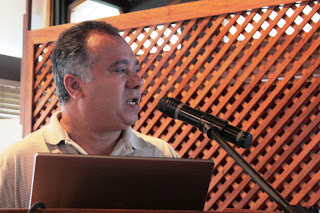
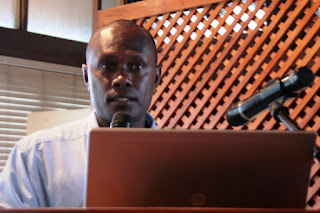
The last presentation of the day was given by Jonathan Tifiariki, Deputy Director of the National Disaster Management Office. He provided orientation about the National Disaster Management Plan (NDMP) and raised the issue of potential applications for the integration of P3DM practice into NDMP. In this framework, P3DM could be employed to identify high risk areas to include into a Disaster Risk Reduction strategy; the model would help to best plan tailored solutions for risk reduction, disaster preparedness, disaster response, recovery and rehabilitation. In this sense, the use of P3DM in areas facing climate change challenges could serve not only to generate extra data but to also to strengthen the capacity of the people to respond and adapt to the impacts of climate change, raising awareness on those issues and promote a long-term engagement of the communities to adopt sustainable management practices, fostering participation and the take of responsibilities.
At the end of the day, Giacomo Rambaldi drove the attention on the purpose of the workshop from CTA’s perspective. The event, in fact, is framed within a broader series of interventions supported by different agencies. All interventions deal with climate change adaptation and building resilience at community levels. CTA focus is on supporting grassroots in making their spatial knowledge more authoritative and in having their voice heard in climate change adaptation policy development processes. He recalled that the next P3DM activity supported by CTA will be held in Trinidad and Tobago during the months of August 2012. He anticipated that in 2014, CTA will lead the organisation of an international conference with focus on the Small Islands Development States (SIDS) with the objective of sharing lessons learned in SIDS when adopting PGIS/P3DM practices and herewith raise further awareness among policy makers on the need of inclusiveness. He also reported on the interest expressed by some organizations including the National Geographic and Museon in documenting P3DM processes.
At dawn Jacob Zikuli from UNDP Solomon, thanked the representatives of Naro Village for their contribution in the workshop and confirmed UNDP SWoCK support for the implementation of further activities in the area.
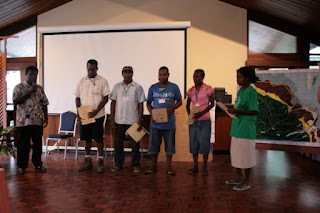
The day closed with the delivery of the certificates to Naro representatives.
Both speakers agreed on the fact that TEK provides unique historical, and frequently offers ecosystem linkages that science can not. However, for being based on repetitive observation, trial and error, TEK might have a limited ability to detect and deal with rapid changes, such as those related to the impacts of climate change. Therefore, the need to bridge the gap between local knowledge and science becomes urgent to find sustainable solutions for ecosystem management and adaptation to climate change. If, on the one hand, the incorporation of TEK into scientific tools (such as GIS) can provide an useful platform to document and give value to TEK in contemporary contexts, on the other hand the development of easy-to-use scientific tools for communities can enhance people’s engagement in the conservation activities, increasing their self-resilience, specially in those countries where government capacity is limited.
Joseph Salima from the village of Naro, presented the 3D model to the workshop participants on the behalf of the village representatives: “The model is now done. You can see the blue lines These are rivers; dark blue lines indicate streams”, he explained while finger-pointing to the features. “Some cross the main road because during flooding the water runs over the road. The yellow line indicates the main road. Within the model there are two mountains covered by dense forest where our ancestors used to practice sacrifices. These are the places were our ancestors lived before the Christianity came. They lived there (upland) because of hunting. The brown lines are the tracks people used to follow during hunting. (…) White areas are flood areas.
The brown colour signify coconut plantations, that are along the coast. The area outlined by the red yarn is our Marine Protected Area (MPA)”. When questioned on the reason why the locally managed protected area is located in front of the village he replied: “Our place is here so we have the full sight on the protected area. We could not establish it elsewhere because people from other villages could have had something to say. We want to protect this area because the population in the village is growing and we are experiencing shortage of resources” he specified. Joseph continued by identifying other landmarks and areas, including home gardens, coconut plantations, households, the school, springs¸, swamps and mangrove areas.“ The area painted dark green with light green points indicates the area were logging took place. The logging concession has come to an end and the forest is recovering. We hunt wild pigs there” he added.
P3D Model gave villagers the opportunity to visualise and further their understand their land and resources “we discovered there are slopes we never saw before that could not be used for agriculture; now with this model we can see them”.
On day 6 the organisers have planned to transport the model to Naro and officially hand it over to the local community. The community itself will decide to what uses it will put it in addition to participatory spatial planning. Considering the fact that the area is prone to natural disasters such as flooding, it is likely that it will be used to also to strategise on climate change adaptation.
Villagers stressed the need to further involve elders in the identification of other landmarks and features that they might do not know. “This model is maybe 90% correct; it is quite clear but we needed somebody as my father, or somebody from the village that used to hunt wild pigs everyday for a long time” Joseph highlighted. “If elders were involved in populating the model it is likely that up to 50 layers could have been identified so far” commented Dave de Vera. Village representatives also expressed their intention to extend the model involving other parts of the marine and forest conservation areas.
Back to the plenary session, Nate Peterson GIS geek working for TNC, explained how to capture data via digital photography and he provided a practical demonstration of data extraction and geo-referencing, using a high resolution image of the completed 3D Model. He also cross-checked peoples’ data against official datasets and could demonstrate how accurate and precisely geo-located some features entered by community members were.
The experience of the Chivoko community in using P3DM and participatory video (PV) was shared by Mr Kiplin, chief of the village. “It is a privilege of be here today on behalf of my community”, he said. “Comparing with other communities, my community was the first in to use P3DM. Two of the main issues we are facing here in Solomon Islands are logging and mining. Mining is recent while logging has been practiced since a long time (…). From a village perspective, making a PV has been a useful experience since it gave us the opportunity to portray a real picture of the logging activities undertaken in our area. In making a video everybody can see the reality of the community” he pointed out.
At the end of the day, Giacomo Rambaldi drove the attention on the purpose of the workshop from CTA’s perspective. The event, in fact, is framed within a broader series of interventions supported by different agencies. All interventions deal with climate change adaptation and building resilience at community levels. CTA focus is on supporting grassroots in making their spatial knowledge more authoritative and in having their voice heard in climate change adaptation policy development processes. He recalled that the next P3DM activity supported by CTA will be held in Trinidad and Tobago during the months of August 2012. He anticipated that in 2014, CTA will lead the organisation of an international conference with focus on the Small Islands Development States (SIDS) with the objective of sharing lessons learned in SIDS when adopting PGIS/P3DM practices and herewith raise further awareness among policy makers on the need of inclusiveness. He also reported on the interest expressed by some organizations including the National Geographic and Museon in documenting P3DM processes.
The day closed with the delivery of the certificates to Naro representatives.
An initiative supported by:
Read more:

.JPG)
.JPG)
.JPG)
.JPG)
.JPG)
.JPG)
.JPG)
.JPG)
.JPG)
.JPG)

.JPG)
.jpg)

.JPG)
.JPG)
.JPG)
.JPG)

.JPG)
.jpg)
.JPG)
.JPG)

.JPG)

.JPG)
.JPG)
.JPG)
.JPG)

.JPG)
.JPG)
.JPG)
.JPG)
.JPG)
.JPG)
.JPG)


